Server Overview Page
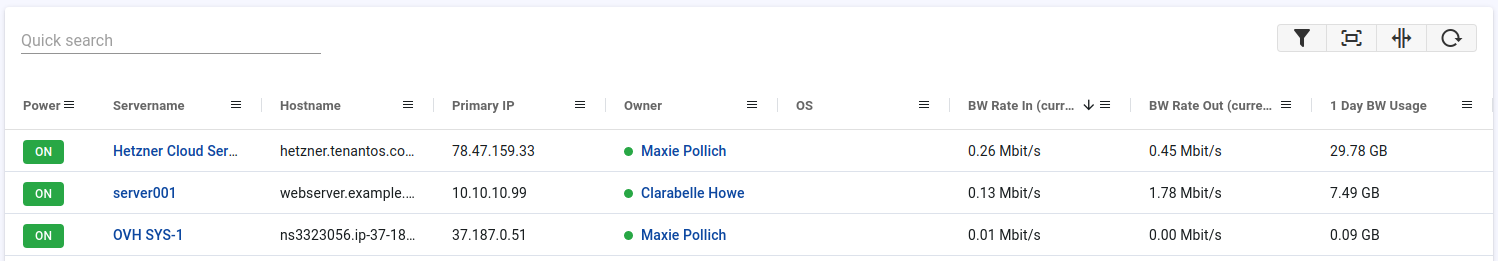
The server overview page gives you a quick overview of all your servers. The table has the following features that help to quickly find the right servers:
- Add / remove columns
- Organize columns
- Quick search
- Combinable column search
- Combinable column filters
- Combinable sorting
Editable columns
Certain columns are editable, providing the convenience of editing common data across multiple servers quickly. When a column is editable, the mouse cursor changes to indicate that the value can be modified by double-clicking.
Personalization
You can fully customize the table so that you always see the data that is relevant to you.
- Click on the funnel icon to select the columns you are interested in. You can also remove the columns which you are not interested in.
- Click on the column title and hold to order the columns.
- Click on the column title to sort the data.
To permanently save the personalized table layout, click on the funnel icon, click "Save Permanently" and choose the save method. Following save methods are available:
- Save columns
- Save columns + sorting
- Save columns + sorting + filters
The "Save Permanently" dropdown additionally provides a "Save column widths" checkbox that can be combined with any of the save methods. When enabled, the current column widths are persisted together with the selected save mode. Saving without the checkbox clears any previously saved widths and restores the automatic horizontal-fit behavior.
The server name column can also be hidden by default through the system settings. When the column is hidden, the clickable server link automatically moves to the hostname column. Saved layouts always take precedence over the default.
Quick Search
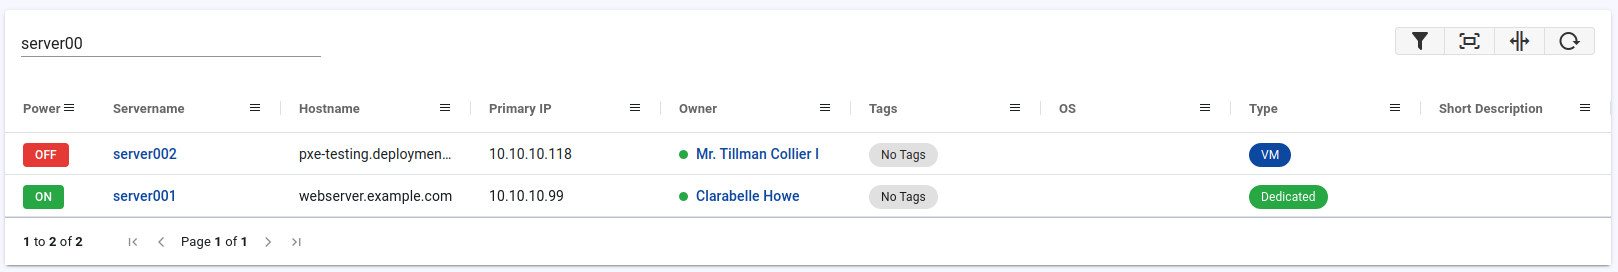
You can enter several terms in the quick search bar, and if the terms are found in the same row, the row will be shown.
As example: on for rent
on is the power status and for rent the assigned tag.
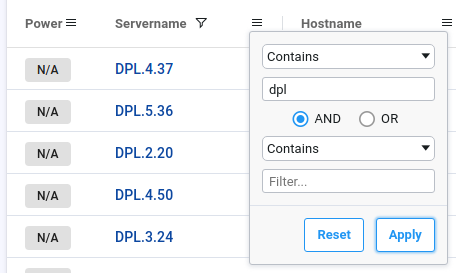
Column Filters
Click on the list symbol in the column title to open the filter options. You can combine several filters (AND/OR) and set filters on several columns, which are dependent on each other.
CSV Export
The table can be exported as a CSV file. This functionality is accessible from the table header under the three dots symbol. The export includes the current table view, preserving the column order, visibility, and filters.
Available Columns
The available columns depend on the permissions of the user account. Provided that the user account has all permissions, the following columns are available:
- Server ID
- Power status
- Servername
- Hostname
- Primary IP
- Owner
- Tags
- Installed OS
- Type (VM or dedicated)
- Short description
- BW rate in (last bandwidth usage rate in mbit/s)
- BW rate out (last bandwidth usage rate in mbit/s)
- 1 day bandwidth usage (in GB)
- 7 days bandwidth usage (in GB)
- 30 days bandwidth usage (in GB)
- 95th percentile in (last 30 days)
- 95th percentile out (last 30 days)
- 95th percentile total (last 30 days)
- Running install tasks (shows if server is running a installation task)
- CPU model
- Amount of physical CPUs
- Amount of CPU cores
- Amount of CPU threads
- Memory count (amount of installed memory modules)
- Memory (summary, total GB)
- Memory (details)
- Disk count (amount of installed disks)
- Disks (summary, total GB)
- Disks (details)
- Mainboard model
Screenshots